

Access interactive dashboards and visualizations on Solidata. These visualizations provide insights into local social-service needs, challenges, and trends.
Solidata is designed for all stakeholders who require social services visualizations and data to:

Use case: conduct a Social Needs Analysis (ABS) to analyze the alignment between local supply and demand for access to rights.

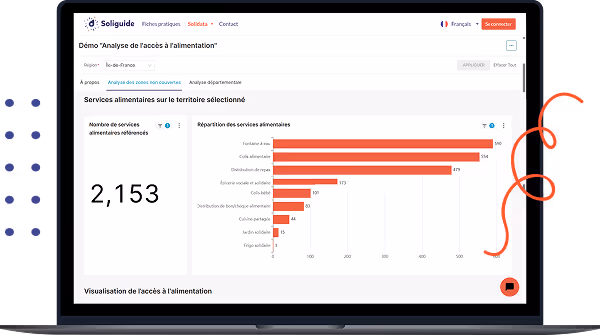
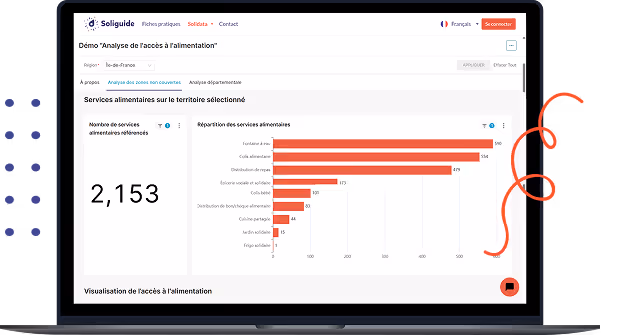
Use case: diagnose the availability of food aid, based on facility saturation, closures, operating hours, and geographical distribution.

Use case: observe a peak in user searches on Soliguide for a service or anticipate exceptional service closures.
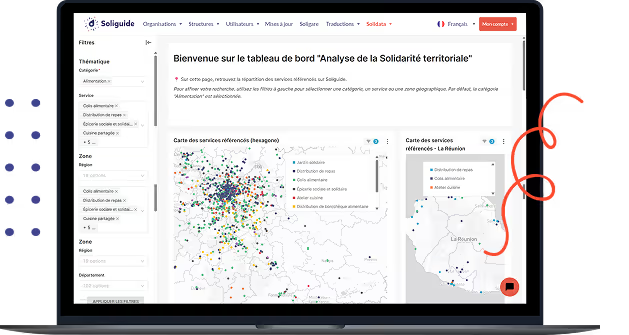
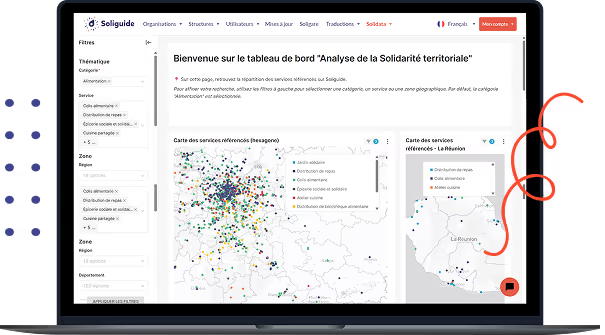
Solidata brings together a set of dashboards whose data comes from Soliguide.
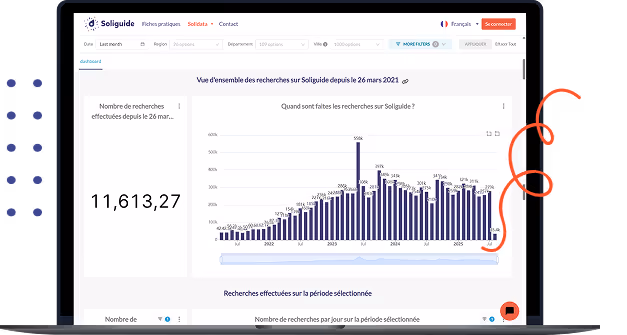
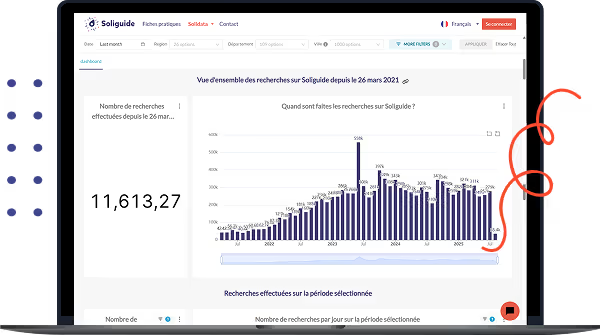
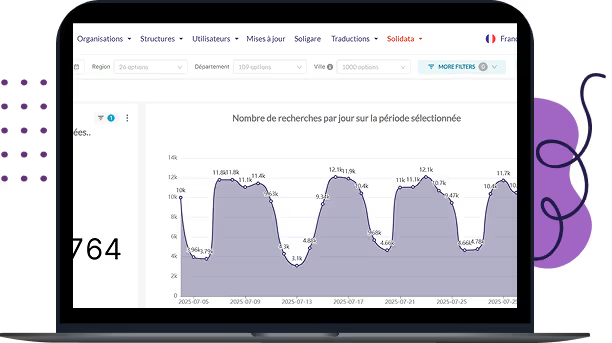
Track all searches performed on Soliguide within a territory.
Analyze changes in social services during summer and winter periods.
And many more dashboards! Contact us to access even more visualizations, such as the social services offering in one or more territories.


